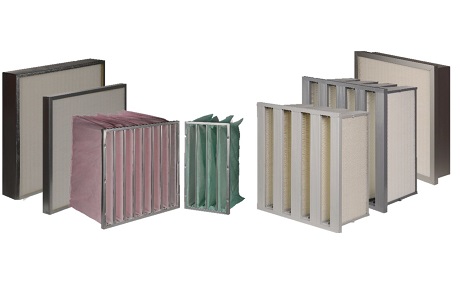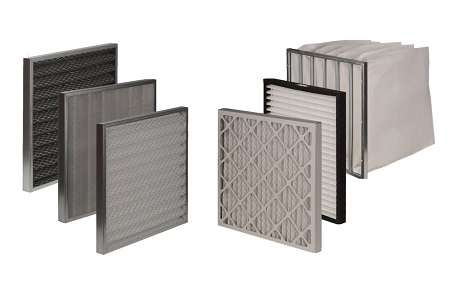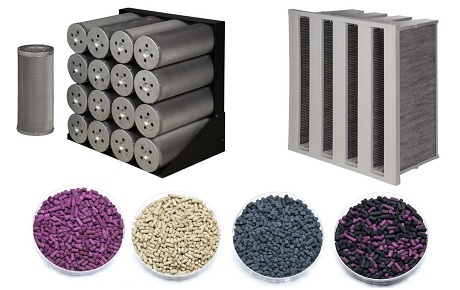
Eurovent 4/23-2022 links outdoor air quality and the required supply air quality to the filtration efficiency a ventilation system needs. Its fourth edition uses the WHO's 2021 air quality guidelines, so an ODA/SUP table based on the earlier WHO values can lead to a different filter selection. Check the edition before copying a specification. Eurovent's publication announcement
Start with what the building needs and what enters the air intake. Then check what the selected filtration stages can deliver together. A label such as F7, F9 or ePM1 80% does not answer all three questions.
Why the reference values matter
The WHO's 2021 guidelines set annual mean guideline levels of 5 µg/m³ for PM2.5 and 15 µg/m³ for PM10. These are health-based recommendations, not universal legal limits. Annual means also serve a different purpose from the short-term measurements shown on a live air quality display. WHO air quality guidelines, WHO guideline values
Use data that covers the relevant period when preparing the filter schedule. A single clean morning cannot establish the outdoor air category, and one dusty afternoon does not describe the entire year. Keep the source, monitoring location and averaging period with the design calculation. The next person reviewing it needs that context.
Eurovent 4/23 is a selection recommendation. The underlying ISO 16890 series classifies general ventilation filters by particulate matter efficiency. The two documents have different jobs: one describes filter performance; the other helps designers use that performance when making a selection. ISO 16890-1:2016 scope, Eurovent 4/23 publication page
The 2022 ODA/SUP values
The table below brings together the outdoor categories, supply concentration targets and minimum efficiencies from Eurovent's fourth edition. Concentrations are annual means in µg/m³; each pair shows PM2.5 / PM10.
| Outdoor category | Outdoor concentration thresholds | SUP1: ≤1.25 / ≤3.75 | SUP2: ≤2.5 / ≤7.5 | SUP3: ≤3.75 / ≤11.25 | SUP4: ≤5 / ≤15 | SUP5: ≤7.5 / ≤22.5 |
|---|---|---|---|---|---|---|
| ODA1 | ≤5 / ≤15 | ePM1 70% | ePM1 50% | ePM2.5 50% | ePM10 50% | ePM10 50% |
| ODA2 | Above ODA1; up to 7.5 / 22.5 | ePM1 80% | ePM1 70% | ePM2.5 70% | ePM10 80% | ePM10 50% |
| ODA3 | >7.5 / >22.5 | ePM1 90% | ePM1 80% | ePM2.5 80% | ePM10 90% | ePM10 80% |
Scroll the table sideways to see all columns →
The efficiencies apply to one filter or the combined performance of multiple stages. The recommendation also specifies a final stage of at least ISO ePM1 50% for SUP1 and SUP2, and ISO ePM2.5 50% for SUP3. These footnotes must stay with the table. Eurovent 4/23-2022, Tables 1–3
If PM2.5 and PM10 indicate different outdoor categories, ask the designer to resolve the difference and record the selection basis. Do not average the two pollutants into one value.
Read the selected cell as a system requirement
Consider an example project where the designer has established ODA2 and selected SUP2. The matrix gives ePM1 70%. Use that requirement to compare suitable filter arrangements. The “70%” must describe the right particulate fraction.
Ask which particulate fraction that percentage describes. An ePM10 value cannot be substituted for an ePM1 value. Ask at what airflow the product was evaluated and whether the proposed dimensions match the available housing. Then check the pressure drop at the intended duty.
There may be several workable arrangements. A single suitable filter and a properly selected two-stage arrangement can involve different purchase costs, space requirements and maintenance tasks. A comparison becomes useful when both proposals answer the same performance requirement and use the same operating assumptions.
Write those assumptions beside the selected cell. The team can then check any later substitution against the same duty.
Do not add the percentages of two stages
A simplified estimate works with the fraction each stage allows through. If two stages each remove 50% of the same incoming particle fraction under the assumed conditions, the first leaves 50%; the second removes half of that remainder. The combined removal is 75%, not 100%.
In fraction form:
Combined efficiency = 1 − (1 − efficiency₁) × (1 − efficiency₂)
Treat calculations using broad ePM values as estimates. The first filter changes the particle size distribution reaching the second. Eurovent distinguishes its simplified engineering estimate from a more detailed calculation using the underlying performance data. A borderline result should therefore be resolved with the supplier's data, rather than rounded into a pass. Eurovent 4/23-2022, section 5
Ask the supplier how the combined efficiency was calculated. Two catalogue labels on their own do not show how the proposed filter train was evaluated.
A minimum selection does not guarantee the measured room concentration
ODA3 has no upper concentration boundary. In heavily polluted locations, two sites can share that category while bringing very different particle loads to the intake.
For a simple illustration, an actual 80% reduction in an incoming PM2.5 concentration of 50 µg/m³ would leave 10 µg/m³. This is arithmetic, not a prediction from an ISO ePM1 label. It shows why a broad category and a minimum matrix entry cannot, by themselves, guarantee a particular concentration downstream.
The occupied space adds further questions: how much air enters through doors, what particles are generated indoors, and how much effective ventilation reaches the room? Use the matrix to support design, then check the actual concentration target against the project's conditions. Keep those two decisions visible in the specification.
Compare operating cost after establishing the filtration duty
Once the required performance is clear, pressure drop becomes a useful way to distinguish products. Compare filters at the same airflow and dimensions, with compatible assumptions about operating hours and replacement.
Eurovent 4/24-2023, Update 1, addresses estimates under actual operating conditions. It also explains why lower filter resistance does not automatically produce the same energy saving in every system: the fan control and resulting airflow matter. A constant-flow system with adjustable fan speed behaves differently from a fan left at a fixed speed. Eurovent 4/24, Update 1
For a useful quotation, include the following:
- The outdoor data and chosen ODA/SUP categories.
- Required particulate fraction, efficiency and final-stage minimum.
- Airflow, filter quantity, actual dimensions and available depth.
- Initial pressure-drop limit and the proposed replacement criterion.
- Fan control, operating hours and assumptions used for an energy comparison.
Questions that come up during selection
Can I keep using an old F7 or F9 description?
Keep it as a reference to the existing installation, then specify the actual ISO 16890 performance required. An old label alone does not establish the proposed replacement's measured ePM values.
Does choosing SUP1 automatically mean I need H14?
No automatic H14 decision follows from this matrix. The table addresses general ventilation selection; a cleanroom or process requiring HEPA filtration needs its own application-specific requirements.
Should the table be copied into every tender?
Include the applicable reference and the selected duty. A full table without the chosen category, airflow and acceptance requirements leaves the supplier to guess what the project actually needs.